
Supervisor
Dr Adrian Sutinjo
International Centre for Radio Astronomy Research, Curtin Node, Bentley, Western Australia
2016/11/28 - 2017/02/24
ABSTRACT
The purpose of this project was to develop and optimise the array design of the Interplanetary Monitoring Array (IPMA) radio telescope. The array, proposed by John Kennewell, would be deployed at the Australian Space Academy situated near Meckering, Western Australia. IPMA is comprised of two sub-arrays, the North and South sub-arrays. Each sub-array will be comprised of 2048 antenna elements laid out in 16 rows each comprising 128 elements, i.e there will be 16 elements in North-South (NS) direction and 128 elements in the East-West (EW) direction. The antenna elements will be folded dipoles which have an overall length of 0.4495λ and have separation between the top and bottom wires of 0.036λ. Due to the concerns about interactions with the transmission lines, which are unshielded 300 ohm twin-lead window-line, the elements will be oriented such that the transmission lines and antenna elements are perpendicular, i.e. the antenna elements are oriented NS whereas the transmission lines run in the EW direction. To achieve the necessary beam pattern with the Butler beam-former, the spacing between the elements in the NS direction is 0.5410λ. Due to uncertainty in the specific window-line being used, a worst case spacing of 0.8λ is proposed. This EW spacing will allow for any type of window-line to be used whilst still achieving acceptable results in regards to side-lobe suppression.
1 INTRODUCTION
The purpose behind this project is to produce an optimised design for an Inter-Planetary Monitoring Array (IPMA) radio telescope. Aside from the design being focused on achieving certain scientific goals, the design will be used to evaluate whether or not an array of this type can be constructed on a limited budget and as such be implemented with minimal outlay at various locations around the globe. The driving force behind this initiative is the Australian Space Academy situated in Meckering, Western Australia.
The motivation behind the construction of an array like the IPMA telescope is, as the name suggests, for monitoring the Inter-Planetary Medium (IPM) with a particular focus towards the IPM between Sol and Earth. IPMA, in conjunction with orbital monitoring equipment, will monitor for Coronal Mass Ejections (CMEs) originating from Sol and track them through the IPM. By detecting and tracking these CMEs, it can be determined whether or not the CME will pass close enough to the Earth to cause issues with terrestrial and/or orbital equipment, and if so, provide advanced warning to allow for mitigating action to be taken if possible.
How IPMA is proposed to operate is to create a fan-beam which will cover at least 120° of the sky in the North-South (NS) direction and then perform continuous drift scanning of the sky by making use of the Earth's natural rotation. While scanning the sky. the back-end of the array will detect the scintillation of far off point radio sources such as quasars. The time-scale of the scintillation is related to the media which causes the scintillation. The scintillation which we are interested in is produced by the IPM and is characterised by time-scales on the order of one second (Thompson, 2001). As such we will be looking for variations in our received signal in the frequency range 0.l to 3 Hz.
For the project we wish to constrain and optimise parameters to achieve the best possible performance. However, there are some parameters that are predefined. The predefined parameters are the element type, element material, element height above ground, transmission line type, and beam-former. The antenna elements will be folded dipoles made using 4mm diameter galvanised steel, oriented horizontally such that their centres are a quarter wavelength above the ground. The elements will be connected together along each row using twin-lead window-line with a characteristic impedance of 300Ω. The array will be pointed by making use of a Butler beam-former and the resulting fan beam will cover at least 120° of the sky in the NS direction. This information helps reduce the number of free parameters and provides some practical constraints on our system.
2 BACKGROUND
2.1 Element Design
The first part of the design process is to consider the element to be utilised. In this case we have a folded dipole antenna. Theoretically a folded dipole antenna is modelled by two modes, a transmission mode and an antenna mode, see Figure 2.1. The transmission line mode considers the fact that in reality there is only one output port for the element so current only moves in a loop through the element. The single voltage source is represented by two sources for ease of comparison with the antenna mode. In the antenna mode we consider the fact that both the top and bottom wires will be excited by the incident Electromagnetic (EM) radiation and as such both will have the same voltage induced along their length, and therefore the same current.

With an expression for the current in both modes, we can use superposition of the two modes and then find the following expression for the impedance of the element:
 . . . . (1)
see Appendix A.
By making use of Equation 1 we find, for a set of separation values, the necessary length of the folded dipole such that the element is in resonance in free space. The element is considered to be at resonance when the effective impedance of the element is entirely real and has no, or a very small, reactive component. Once we have associated element lengths for the separation values, we simulate these elements as a single element over a Perfect Electrically Conducting (PEC) ground and observe the gain of these elements in the direction normal (upwards) to the ground plane.
Element Orientation
The element orientation effects how the elements and the transmission lines interact with each other. Initially this might seem like a somewhat ambiguous parameter but a possible source of interference is the transmission lines. If the transmission lines are a possible source of interference then we want the elements and transmission lines to be perpendicular to each other to reduce the interference. Also, the practical consideration of the finite size of our elements is important. The separation of elements in one direction will be constrained to being larger than the element length before we even begin to consider any other factors.
Sky Coverage
The sky coverage of the array will be defined by the Butler beam-former. For the Butler beam-former the angle of sky coverage is given by the equation:
 . . . . (2)
where λ is the wavelength of the frequency of interest. N is the number of inputs to the beam-former, and d is the separation between the receiving elements (Hansen, 1998), For our array we have 16 rows of 128 elements, with each row acting as an input to the beam-former. Since we know N, our number of rows, the wavelength of our desired frequency, λ, and we know approximately what our desired sky coverage is, we can re-arrange Equation 2 to give us an approximation for the required spacing:
 . . . . (3)
We then simulate a subset of the array across a range of element separations centred at the separation found analytically with Equation 3.
Transmission Lines
Since the distance that information needs to travel through the feed lines of the array is an appreciable amount of the information wavelength, ≥0.1λ, we must consider transmission line effects (Pozar, 1990). The main objective we wish to achieve is to have the best performance at our frequency of interest, or centre frequency. To achieve this the path length through the transmission line must be exactly one wavelength with the proviso that the information is no longer travelling through free space but rather the dielectric medium which is used in our transmission lines. This means that the information is no longer travelling at the speed of light through a vacuum, c0, but rather some fraction of c0 which is given by the velocity factor of the transmission line, vp (Cheng, 1989). When EM information passes from one medium to another the frequency does not change. This means that if the speed of light through the medium changes then so too must the wavelength of the information. Using this relation we can say that:
 . . . . (4)
where λ is the free space wavelength and λtrans is the wavelength through the transmission line. Using this we can say that the separation between the elements, in the direction the transmission lines are fed. cannot be greater than λtrans. If the separation is less than λtrans we simply allow the transmission lines to sag.
The next consideration is the effect that the transmission lines have on the bandwidth of the array. At the centre frequency the transmission lines have the least effect on the output. However, at frequencies other than the centre frequency the elements are no longer one wavelength apart and the transmission lines start to become lossy and an appreciable amount of power starts to be lost across the transmission lines. The amount of power lost through the transmission lines is dependant on the frequency and the mismatch between the element impedance and the transmission line characteristic impedance (Cheng, 1989 & Pozar, 1990). This frequency dependence affects the bandwidth of the array where the bandwidth is determined by some threshold on how much of the overall power is lost through the transmission lines at that frequency.
3 RESULTS
3.1 Folded Dipole Element
With respect to the folded-dipole element, a range of separations and lengths were found for which the element was at resonance in free space. To quantify which of these was more desirable, these elements were then simulated taking into account a PEC ground and observing which has the greatest gain.
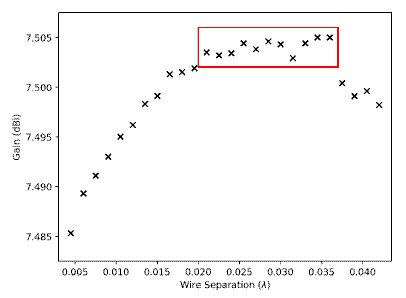
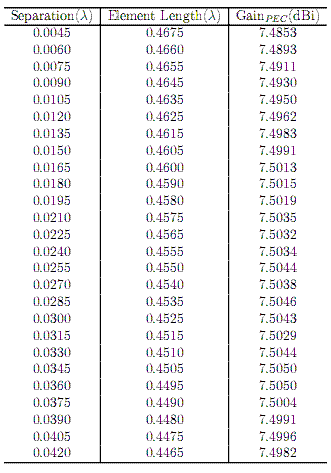
The region bordered by the red box in Figure 3.1 represents the optimum range of separations and therefore element lengths, which results in the best design. With foresight to determining the element spacing, we choose the element parameters from this region which results in the shortest element. The resulting folded-dipole has a wire separation of 0.036λ with an associated overall element length of 0.4495λ (see Appendix B).
3.2 Element Spacing
The spacing of the elements is determined, in the NS direction and also the EW direction. In the NS direction the element spacing is constrained by the implementation of the Butler beam-former and the physical length of the elements. In the EW direction the spacing is constrained by the velocity factor of the transmission lines, the individual element impedances, and the gain pattern.
With reference to Equation 3 it was found analytically that the optimal separation to achieve 120° sky coverage was ≈0.5413λ. When the system was simulated in FEKO, it was found that the separation for which we had the greatest difference between the main lobe gain and largest grating lobe gain was 0.5410λ (see Figure 3.2). Given that our chosen element length is 0.4495λ this spacing is practically, as well as theoretically, suitable.
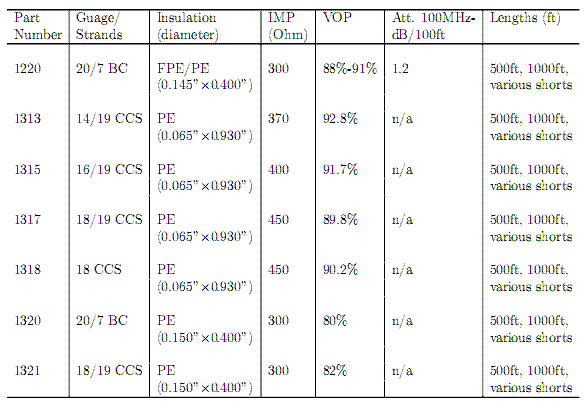
With respect to the transmission line velocity factor, there is some uncertainty regarding the exact twin-lead window-line to be used. As such, a worst case velocity factor of 0.8 is being assumed for the transmission line (see Appendix D), which means that the elements cannot be more than 0.8λ apart. When the array is simulated with this spacing implemented it is observed that all of the elements have finite impedances at all pointings and that the beam width in the EW direction is very narrow and has good side-lobe suppression, see Figure 3.2.

4 DISCUSSION
The array built at Cambridge by Hewish and Duffett-Smith used an operating frequency of 83 MHz. However, a slightly higher frequency allows the construction of a more compact array and allows the observations of scintillations closer to the Sun (Hewish, 1987). The frequency chosen for IPMA was 110 MHz, just above the FM band and clear of any significant Radio Frequency Interference (RFI) - see Appendix C.
The folded-dipole elements were primarily designed to be as short as possible while still achieving the best gain. The desire for a shorter element came from practical concerns about the physical proximity of the elements to each other and concerns about them touching. With an element separation of 0.5410λ and an element length of 0.4495λ the elements are ≈ 30 cm apart at our frequency of interest. As an aside, the element lengths needed for resonance became shorter as the wire separation increased.
The element orientation was set such that the elements were oriented in the NS direction. This orientation was chosen due to the fact that the elements are to be fed in parallel along each row and there were concerns about interference between the transmission lines. If we were using a shielded transmission line such as co-axial cable, then we would not have to worry about this interference. However, co-axial cable is unsuitable for our purposes but twin-lead window-line on the other hand is. Twin-lead window-line is unshielded so we do have to take into account the interference. Since the rows of elements run in the EW direction the transmission line will run in the same direction. To minimise the interference we orient the elements perpendicular to the transmission lines, i.e. orient the elements NS.
The separation in the NS direction is not a parameter that can be changed significantly without losing performance in the fan beam, see Figure 3.2. If the elements are brought closer together we achieve better sky coverage but the side and grating lobes become much larger very quickly. If the elements are moved further apart then we no longer achieve the necessary sky coverage and, for the folded-dipole case, the grating and side lobes increase.
The separation in the EW direction has some flexibility. At the moment the elements are set to be 0.8λ apart to cater to a worst case scenario in terms of the transmission line velocity factor, see Appendix D. From Figure 3.2(b) we see that while the beam pattern in the EW direction is good, it was observed that a separation of 0.8995λ gave the best side-lobe suppression. If, at a later date, it is determined that we no longer need to cater to a worst case scenario velocity factor of 0.8 then increasing the element separation towards 0.8995λ will improve the performance of the array. At separations larger than 0.8995λ the side and grating lobes start to increase again. Care should be taken when adjusting the element separation that all of the elements have finite impedances at the new separation. It has already been verified that the elements do have finite impedances at 0.8000λ and 0.8995λ.
At the time of this report being written, work was still continuing with regards to the array bandwidth limitations imposed by the transmission lines. At present, methodology for calculating the loss through the transmission lines is progressing with work being done on formulating suitable approximations for the transmission line parameters, see Appendix E. Once the parameters have suitable approximations and the method for analysis has been decided we can determine the loss through the transmission line at frequencies other than the centre frequency. This would allow us to quantify the bandwidth of the array.
A practical concern for the transmission lines is similar to that raised for the folded-dipole elements, the local fauna. It would need to be ensured that however the transmission lines are connected to the elements, the connections are physically strong enough to prevent the transmission lines from becoming disconnected due to birds etc. landing on them. Furthermore the physical strength of the transmission lines would need to be such that the weight of local fauna landing on them does not snap the lines. Additionally, given the previous two considerations have been satisfied, it would need to be ensured that the stake holding the dipoles above the ground had sufficient purchase that the tension in the transmission line due to a bird landing on it did not pull the element over. Aside from that is the concern over fauna chewing on the transmission lines.
Over the course of the project one of the key considerations was the practical implementation of the design. In determining the parameters they were all left in terms of λ since most of the interactions are determined by how many wavelengths they are apart. This allows for the design to be implemented for any centre frequency with limited need for changes to the simulations for re-verification. In terms of accuracy it was decided that an accuracy of ≈ l mm was suitable, which corresponds to 0.0005λ for our frequency of 110 MHz. In terms of variation from the specified results during implementation, variations of ≈0.001λ or ≈ 3 mm, although undesirable, should have minimal impact on the performance and operation of the array.
The largest issue experienced with this project is that it is very difficult to break it down into a series of isolated problems which can be considered one at a time. Changes in any of the parameters tend to have a ripple effect through the entire design. This means that at the end of each stage, all of the previous stages must be re-verified to ensure that there have been no adverse effects on the overall system. As a result it is important at each stage to develop an efficient and automated process which requires little effort when performing verification.
5 FUTURE WORKS
There is still much work to be done towards the design of IPMA. As mentioned in the discussion, the current problem being worked on is the effect of the transmission lines on the bandwidth of the array. If the bandwidth performance of the array does not meet the 1MHz requirement, then it may be necessary to implement some sort of matching circuitry. The issue with this is that the effective impedance of the elements is different from row to row and for each pointing. Once the bandwidth of the array has been determined, and after any necessary design changes have been implemented to achieve the desired minimum bandwidth, the signal from each row then has to go through an amplifier. On the topic of implementing the amplifier Dr Adrian Sutinjo has suggested starting with the Low Noise Amplifier (LNA) used for the Murchison Wide-field Array (MWA) since its performance is well characterised. As it is currently understood the last part of this project would be to determine the cheapest method for implementing a Butler beam-former.
6 CONCLUSIONS
Over the course of this project we have been able to impart some additional constraints on the design of IPMA. The folded-dipole element now has a defined length of 0.4495λ and a wire separation of 0.0360λ given that the material used is the 4mm diameter galvanised steel. These elements will be oriented in the NS direction to minimise interference from the transmission lines. The separation between the elements in the NS direction is constrained to 0.5410λ due to the requirements of the Butler beam-former. The separation between the elements in the EW direction is currently defined as the worst case 0.8λ. There is an allowance that if the transmission line chosen has a velocity factor of more than 0.8 then the elements can be moved further apart with side lobe suppression improving up to a separation of 0.8995λ. The next part of the project to consider is the effect of the transmission lines on the bandwidth of the array.
7 REFERENCES
[1] ASA, 2017, "The ASA Radio Frequency Environment". Australian Space Academy, <spaceacademy.net.au/asa/rf.htm>
[2] Balanis, C.A., 2016. "Antenna Theory Analysis and Design", 4th Ed, New Jersey, Wiley
[3] Cheng. D.K., 1989. "Field and Wave Electromagnetics", 2nd Ed, Massachusetts, Addison-Wesley
[4] Hansen, R.C.. 1998. "Phased Array Antennas", New York, Wiley
[5] Hewish, A.. Duffett-Smith, P.J., 1987. "A New Method of Forecasting Geomagnetic Activity and Proton Showers", Planetary Space Science, 35, 487
[6] Pozar. D.M.. 1990. "Microwave Engineering", Massachusetts, Addison-Wesley
[7] Seminole, 2017, "Signal Type - Radio", Seminole Wire and Cable, <http://www.seminolewire.com/pdf.Signal%20Type%20-%20Radio%2012.22.16.pdf>
[8] Stutzman, W.L., Thiele, G.A., 2013, "Antenna Theory and Design", 3rd Ed, Wiley
[9] Thompson. A.R.. Moran. J.M., Swenson. G.W., 2001, "Interferometry Synthesis in Radio Astronomy", New York, Wiley
APPENDICES
A: Folded-Dipole Element Impedance
See reference (Stutzman, 2013) pages 161 to 166 for the unabridged version of the following. Please also note that some of the variable names have been changed to fit with Figure 2.l. These include the element length which has been changed from upper-case 'L' to lower-case T, and the wire separation which has been changed from 'd' to 's'. In the transmission line mode of the folded-dipole, the input impedance is given by:
 . . . . (5)
where Z0 is the characteristic impedance of the transmission line,
 . . . . (6)
'l' is the length of the Folded-Dipole, 'a' is the radius of the material the dipole is made of, and 's' is the separation between the centres of the top and bottom wires. If we assume for a moment that the top and bottom wires are not connected, then by applying Ohm's law we can find our transmission line mode current:
 . . . . (7)
In the antenna mode of the folded-dipole the input impedance is given, to the first order, as that of an equivalent dipole with the same element length and constructed of the same material. The input impedance of the equivalent dipole, Zd, has to be found numerically and is typically found by performing Method of Moments (MoM) analysis. The interested reader is directed to Chapter 14 of "Antenna Theory and Design" by Stutzman and Thiele (Stutzman, 2013) which covers Method of Moments (MoM) analysis. In practice it is best to use simulation software, such as FEKO, which performs these analyses for us and then apply the results. The total current through the wire is:
 . . . . (8)
However, unlike the transmission line mode where the total current of the mode is represented by the current in either of the wires, the total current of the antenna mode is actually the sum of the currents in both wires, i.e. the current flowing through the wire in the antenna mode Ia is only half the total current of the antenna mode:
 . . . . (9)
When we superimpose the transmission line mode with the antenna mode we observe that the voltage sources on the bottom, or left, wire combine such that the total voltage is V. Whereas on the top, or right, wire the voltages cancel each other out. As such we can say that the total current through the element is given by:
 . . . . (10)
and since the total voltage driving this current is simply V, we can say that the total dipole impedance is:
 . . . . (11)
Substitute in Eqn 7 and 8 and then re-arrange:
 . . . . (12)
If we fully expand it out by substituting in Eqns 5 and 6 we can see explicitly all of the parameters that may vary:
 . . . . (13)
where Zd(a,l) is the simulated value of Zd for that particular element length and material radius.
B: Folded-Dipole Over Ground Raw Data
C: Radio Frequency Environment at Australian Space Academy Site

Plot taken from the Australian Space Academy website (ASA, 2017)
D: Window Line Specifications
Acronyms:
E: Transmission Lines
This entire section is summarised and paraphrased from "Microwave Engineering" by David M Pozar. For more detail the interested reader is directed to this text (Pozar, 1990).
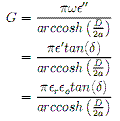
A transmission line is represented by a lumped circuit with following quantities.
1. Series Resistance (Ω/m):
 . . . . (14)
 . . . . (15)
 . . . . (16)
 . . . . (17)
These quantities are then used to determine the transmission line parameters:
1 Complex propagation constant
 . . . . (18)
 . . . . (19) & (20)
 . . . . (21)
 . . . . (22)
E2: Methodology
Due to the sheer size of the rows, it is impractical to simulate the circuit in dedicated circuit simulation software. Instead we will make use of the ABCD parameters of the elements and the transmission lines that connect them.
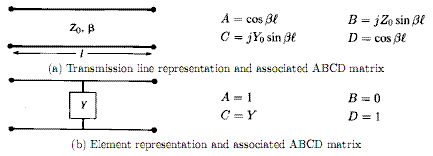
The ABCD matrix allows us to relate the input voltage and current of a circuit to the output voltage and current like thus:

In the case of having many circuits in series, ie a transmission line followed by an element, then we can find the overall voltage and current by simply multiplying the ABCD matrices of the circuits:
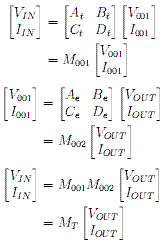
Given that we know that Iout will be zero, and we define Vin to be an arbitray 1 (one) volt, then using our equivalent ABCD matrix MT we can find both IIN and VOUT. Furthermore, from our equivalent ABCD matrix

we can find the overall impedance of the system:

Now that we know the IIN of our system, we can find the voltage and current through any part of the system given we either multiply the ABCD matrices up to that point, or multiply the equivalent matrix, MT, by the inverse ABCD matrices as you work back through the system.

With our IIN and ZIN we can find the overall power of the circuit

Once we know the overall power of the circuit, we can then find the power across each of the elements and see what proportion is associated with the elements and how much is lost across the transmission lines. This can be found by determining the current that flows through each element. The current through each element can be found by taking into account that once we calculate the ABCD matrix, we know the current into the circuit and current out of the circuit. The difference between the current in and current out must, by Kirchoff's Current Law (KCL), be the current through the element. Since we know already what the impedance of each element is, it is trivial to calculate the element power:

We then sum all the element powers and compare the total element power to the total circuit power.
 Australian Space Academy