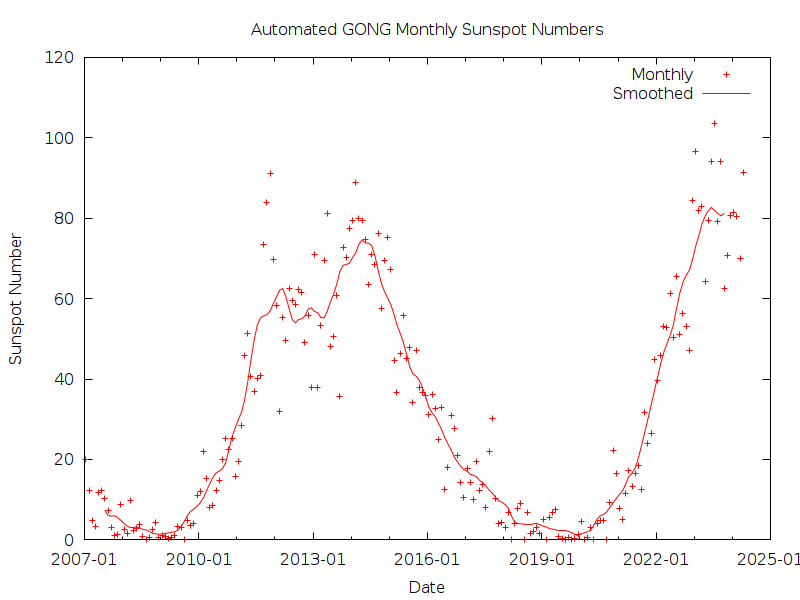
Monthly and Smoothed Sunspot Number

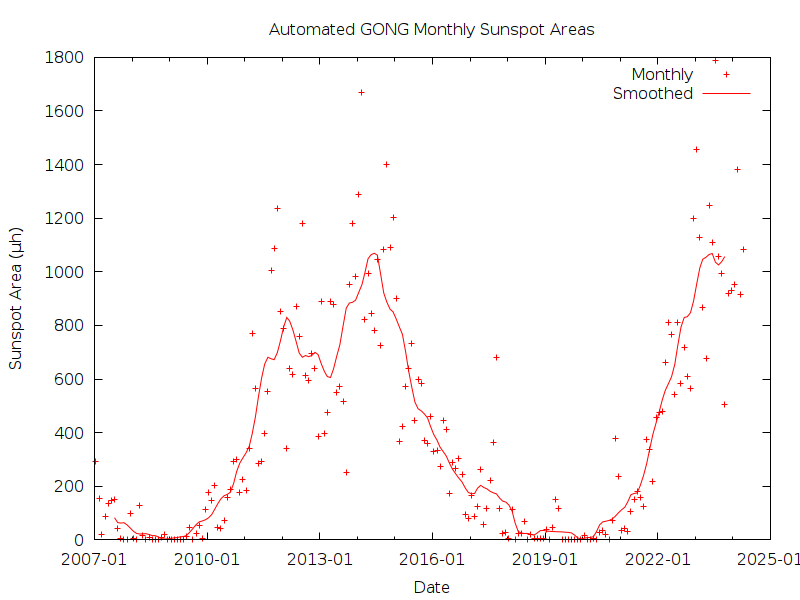
Monthly and Smoothed Total Sunspot Area in Microhemispheres
by Owen Giersch
DATA
The graphs below show the sunspot number and total sunspot area that have been determined by an automated system developed by the author as part of his PhD studies. This data has been produced using solar white light and magnetogram images produced by a network of six stations spanning the globe and set up and maintained by the US National Solar Observatory Global Oscillation Network (GONG).


Monthly and Smoothed Total Sunspot Area in Microhemispheres
Details about the above graphs are given below.
TEXT DATA
Tables of the data used to plot the above graphs.
EXPLANATION
Sunspot numbers have now been recorded for several centuries, although accurate sunspot numbers can only be derived for no more than ~200 years. Even the accuracy of this data set has recently been questioned in a series of Sunspot Number Workshops.
It has become apparent that one continuous data stream from a single institution will usually last no more than several decades. This is due to personnel changes and fiscal policies. There are gaps between when one organisation terminates their recordings and another takes it up. This makes it very difficult to maintain a well calibrated data set over very long periods of time.
We believe that the best way to ensure that future researchers will be able to calibrate past solar data is to try and maintain several independent and overlapping data streams. To this end we present the ASA data stream on sunspot number and sunspot area. This has been derived from automated image analysis of an automated network of six solar observatories around the world. We believe this probably approaches the most objective determination of sunspot parameters that has so far been produced over nearly a sunspot cycle.
THE IMAGES
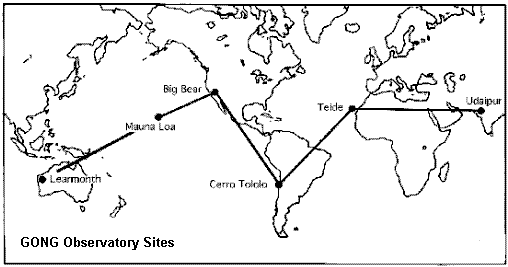
The images used to produce this data stream are taken from the six GONG (Global Oscillation Network Group) Observatories shown on the map below.

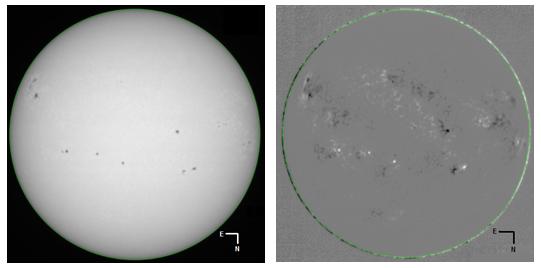
A solar white-light image and a magnetogram (among other images) are produced by each observatory every minute. Data is sent to a central repository in Tucson, Arizona. An example white-light image and magnetogram are shown below. The original images are 860x860 pixels.

PROCESSING
Images from all six sites are processed to produce an averaged daily sunspot number (R) defined as:
A series of automated algorithms are employed to normalise the images, perform limb correction where required (white-limb), identify sunspots and sunspot groups and determine the sunspot number and the total area of the identified sunspots.
RESULTS
The average sunspot number (dimensionless) and the total sunspot area ( in solar microhemispheres where 1 µh = 3.04 million square kilometres ) are determined for each day. All the daily averages are combined to produce a monthly average which is plotted as dots in the graphs above. A 12 month smoothed sunspot number is also computed according to the formula:

The smoothed values are plotted on the graph as a continuous curve. Similar processing is done for the sunspot area. The graphs are updated at the end of each month.
 Australian Space Academy