CLOUD COVER ON NORTH WEST CAPE
by Owen Giersch, ASA Research Scientist
INTRODUCTION
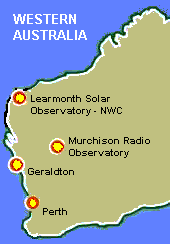 | |
North West Cape (NWC) is located about half-way up the Western Australia coast. It is noted for its low cloud cover, being too northerly for the low pressure systems coming from the south and too southerly for most of the monsoonal weather that affects the north in summer. It is affected by the occasional cyclone, but cloud cover from this source usually does not stay around for more than a few days at most.
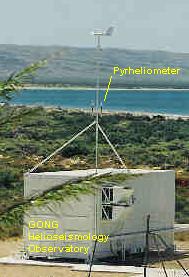
Because of the high percentage of sunshine NWC was chosen as the site of a solar observatory in the 1970's. Over the years Learmonth Solar Observatory (LSO) has also hosted numerous optical sensors, including a Global Oscillation Network Group (GONG) helioseismology observatory. |
Currently four space surveillance telescopes are or soon will be located on the Cape. A laser satellite communications test system is also slated for deployment there.
In light of this, we have undertaken a study of cloud cover over the last two decades, particularly to examine a subjective claim by Learmonth Solar Observatory staff that there has been a significant increase in cloud cover over that period of time, possibly related to climate change in which the monsoonal weather has moved further south.
INVESTIGATION
|
This investigation was performed using data from Learmonth in the period 1995 to 2012 in order to determine if the amount of cloud had increased during that time. GONG radiometer data was used for this investigation. This data, obtained from a calibrated Qualimetrics Silicon Cell Pyranometer model 3120, gives the solar irradiance in Watts per square metre at a cadence of once per minute. Using this data a clear-sky intensity-elevation curve was determined.
Subsequent data points were then checked against this curve to determine if there was cloud or no cloud. Sunshine percentage or its complement, percentage cloud cover was then determined for each month.
Note that this measure detemines cloud-free line of sight in the direction of the Sun and is thus different from percentage cloud cover as determined by a ground observer. The two measures are of course related, but the more appropriate measure will be determined by the application in question.
It should also be noted that the measure determined here is for daylight cloud cover. Extrapolation to night-time cloud cover conditions may not be appropriate. | |
 |
INTENSITY-ELEVATION CURVE
The Intensity-Elevation curve was created as a histogram for each elevation. The elevation was calculated using the J2000 Ephemeris (available in the Astronomical Almanac). We restricted the analysis to elevations greater than or equal to 10 degrees to avoid severe scattering effects at low sun angles. Therefore 81 histograms from 10 to 90 degrees were generated. Each histogram encompassed a 1 degree elevation range. For example the 45 degree histogram encompassed the range 44.5 to 45.5 degrees. Figure 1 shows such a histogram.
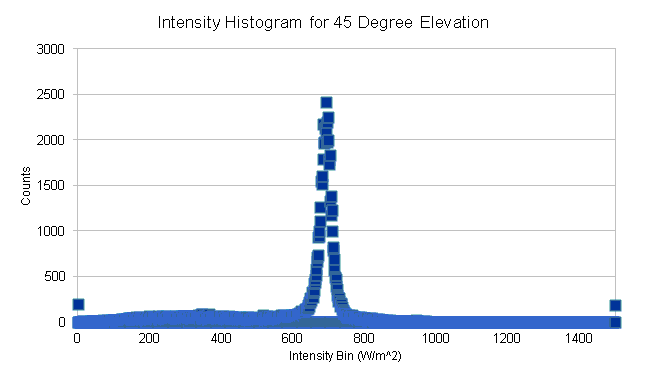
Figure 1: Intensity Histogram for 45 degrees
The radiometer data seems to be quantised at values slightly greater than 1 W/m2. This accounts for the large number of zero bins in this plot (about every 3rd bin). This however does not greatly affect the analysis.
Cumulative histograms are then produced. The median value (the cumulative bin that first equals or exceeds 50% of the total counts) is found and this is accepted as the intensity for that elevation. Figure 2 shows a sample cumulative histogram.
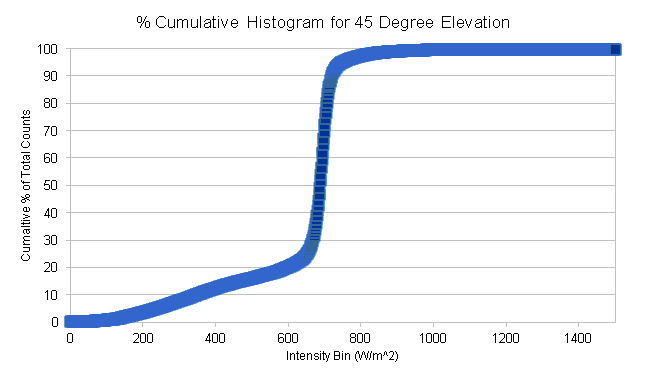
Figure 2: Cumulative Histogram (% Counts of Total) for 45
Degree Elevation. The median given by this plot is 687 W/m2.
Once all of the median values for each elevation have been found, an intensity-elevation plot is generated and a 6th order polynomial fitted. This function is the expected intensity for each elevation. Figure 3 shows this curve.
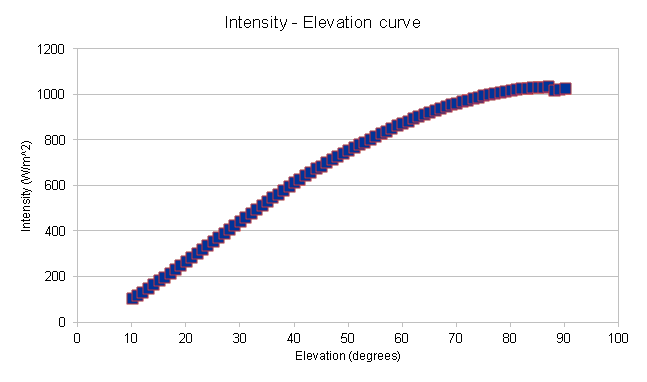
Figure 3: Intensity-Elevation Curve from GONG Radiometer data
The fit for this curve (Equation 1) is:
I (E) = -17.67 + 9.22 E + 0.339 E2 – 3.65x10⁻³ E3 – 5.66x10⁻⁵ E4 + 1.16x10⁻⁶ E5 – 5.64x10⁻⁹ E6
where I is the solar flux intensity and E is the solar elevation angle (degrees).
CLOUD DETERMINATION
A simple test was used to determine if there was cloud or sun in each minute. For each minute the expected intensity was calculated by finding the solar elevation and then using equation 1 to calculate the expected intensity. The threshold value (T) for cloud was taken as:
T = 0.85 I (E) . . . . .(Eq 2)
If the observed intensity is less than T then there is cloud otherwise it is cloud-free.
Figures 4 and 5 show sample results for 2 different days.
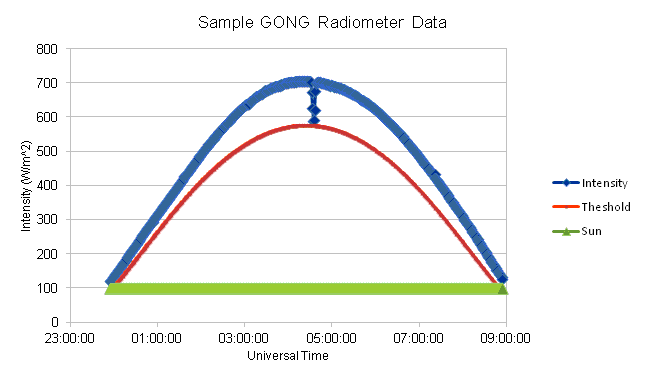
Figure 4: GONG Radiometer data for 2006 June 17. The Blue
curve is the observed intensity, the red curve is the threshold
calculated from equation 2, and the green line has value 100
for sun and 0 for cloud as a result of the threshold test. The
dip in the observed values near the peak is present on each day
and is due to obscuration by a support structure. This plot shows
that there were no clouds present on that day.
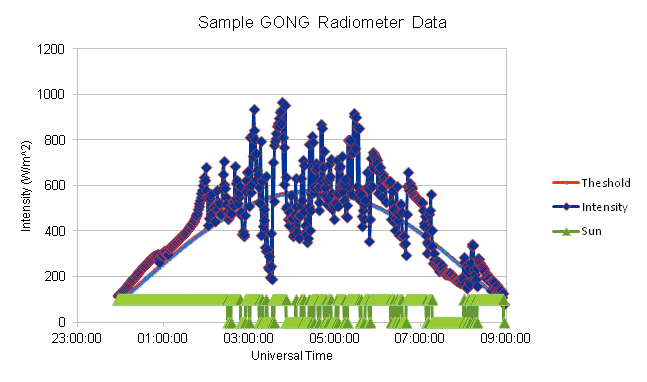
Figure 5: GONG Radiometer data for 2006 June 24. The data
shows that this day’s observations were regularly interrupted
by cloud.
RESULTS
Percentage of sunlight was calculated for each month (the number of minutes of sun divided by the number of minutes of observation). We note here several points that may affect this analysis.
- There may be reduced observations in the period November to April every year due to shut downs from cyclones, although we expect the total downtime to be less than 2%.
- There were times when values of either 0 or 1500 W/m2 were recorded. This is probably an error with the sensor (or possibly deposits left by birds on the sensor). These values were excluded in the analysis.
- There are periods when there is missing data. The most significant data gap is a seven month period in 2001 (there was no data in the files).
Figure 6 shows the percentage sunshine for each month over the 18 years of data processed.
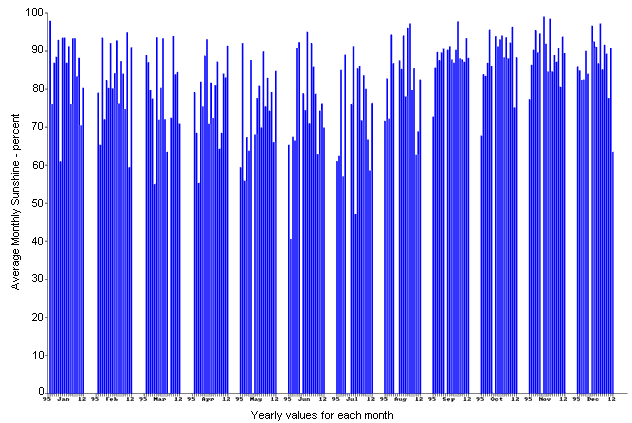
Figure 6: Monthly average sunshine for each year
For any given month there does not seem to be a general decrease in the amount of observed sun from 1995 to 2012, although on a year to year basis the amount of cloud can change drastically in any month. There does not appear to be a systematic change in the amount of observed sun.
The monthly averages have also been combined to produce an average percentage cloud cover for each year. This is presented in tabular form below and in graphical form in figure 7.
Year  Total Sun  Total Time  % Cloud	# Months
      (Minutes)  (Minutes)
1995   100693      143082      29.6         7
1996   184354      227262      18.9        12
1997   168432      217228      22.5        12
1998   172628      216478      20.3        12
1999   187036      220700      15.3        12
2000   130419      158383      17.7        10
2001    59692       74550      19.9         4
2002   188211      214763      12.4        12
2003   186790      219008      14.7        12
2004   191787      224750      14.7        12
2005   182431      216614      15.8        12
2006   178859      210626      15.1        12
2007   182785      208050      12.1        11
2008   188137      225996      16.8        12
2009   185399      224231      17.3        12
2010   177954      217422      18.2        12
2011   175004      226901      22.9        12
2012   181212      223112      18.8        12
|
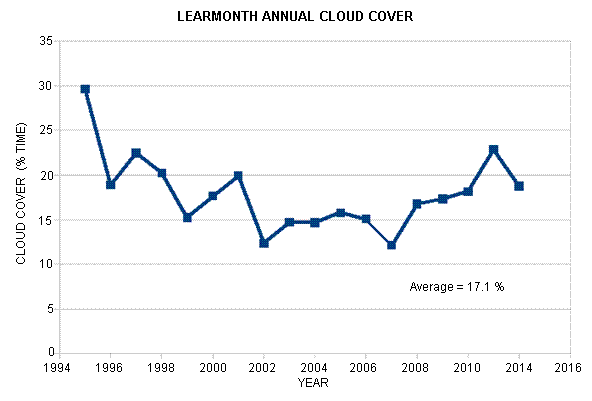
Figure 7: Annual cloud cover at Learmonth Solar Observatory
The annual cloud cover seems to in fact have decreased for the first five years of the study period, remained approximately constant for the next decade with a slight increase at the end of the period. Five months missing data in 1995 may have distorted the initial decrease shown. The data does not indicate a progressive increase over the time shown, contrary to subjective assessment. The average value of cloud cover over the 18 year period is 17%. This compares with a value of 22% obtained at the same site in the decade previous to this study (Hill et al, 1994), using however, a different instrument. If any conclusion is to be drawn it is probably that the site has become less cloudy with time.
ACKNOWLEDGEMENT
We would like to acknowledge the US National Solar Observatory Global Oscillation Network Group for making available the data used in this study.
REFERENCE
Frank Hill et al (37 authors), The Global Oscillation Network Group Site Survey: II Results, Solar Physics, 152, pp351-379 (1994)
 Australian Space Academy