INTRODUCTION
Probably the most damaging space weather event that is associated with Sun is a solar particle event (SPE) in which solar energetic particles (SEP) are accelerated to very high energies. Most of these particles are protons, although there may be an admixture of alpha particles (helium nuclei) and a very few higher mass atomic nuclei. In an SPE these particles are accelerated to energies in the millions of electron volt range (MeV) and just occasionally, in the largest events, to over one giga-electron volt (GeV).
Particles of that high an energy pose a considerable radiation hazard, not just to astronauts but also to electronic equipment. A single large SPE at geosynchronous orbit can damage solar cells on spacecraft to the extent that their useable life is reduced by a third. In August 1972, between the last two Apollo misions (Apollo 16 and 17), an SPE was of such a magitude that had astronauts been walking on the lunar surface at the time they may not have made it back to Earth, or else they would have arrived back with severe radiation sickness. The prediction of SPE is thus a high priority research item in space weather.
A few decades ago it used to be thought that all SPE originated with large flares close to the Sun. Current thinking is that, although a few events may result from direct acceleration by electric fields associated with flares, most of the large events result from acceleration which occurs around shock waves at the leading edge of CMEs, and between two shock waves propagating through the interplanetary medium.
OVERVIEW
The Proton Prediction Model (PPM) presented here was devised by the husband and wife team of Peggy Shea and Don Smart at the US Air Force Research Laboratory around 1976. At that time, as mentioned above, all SPE were believed to have a direct association with solar flares that were due to magnetic energy release in the solar corona. This is now known not to be the case. The basis of the model is thus quite flawed. Nevertheless, it often works in an empirical sense, and is still used by some space weather forecast centres because no better operational model currently exists.
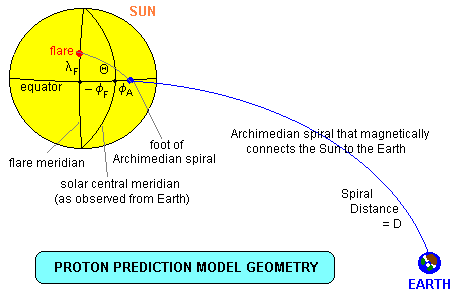
The model assumes the production of high energy plasma by a flare that then diffuses through the solar corona to the footprint of the magnetic field line that connects it along an archimedean spiral (because of solar rotation) to the Earth where the SPE is observed. See diagram below.

PPM ALGORITHM
We note in the above diagram that the flare coordinates are latitude λF and central meridian distance (CMD) or relative longitude -φf. The negative sign is because in the diagram it is shown in the eastern sector. The CMD to the footprint of the Archimedian spiral (along the solar equator) is φA.
From spherical trigonometry we can calculate the angular distance from the flare to the footprint point as:
We assume that an Observer at 1 AU (Earth) observes a particle intensity of:
We also have that:
In polar form the equation for an Archimedian spiral is given by ρ = a θ and the spiral distance is then calculated from:
Travel Time
The minimum travel time in hours for zero pitch angle, from the Sun to the Earth, is given by:
The onset time of the SPE at the Earth is made up of three components; an anomalous delay of 15 minutes; the spiral propagation time given above; and the coronal diffusion time:
Particle Maximum Flux Time
We assume that the average velocity of the bulk of the particles is half that used for tmin. Experimentally it is found that the time of maximum flux is proportional to D2:
It is assumed that the event decays after the time of maximum flux in a typical negative exponential fashion according to the expression:
Maximum Proton Intensity
The maximum intensity of the proton flux is assumed to be related to the peak intensity of the electromagnetic flare, either in the radio spectrum or in the X-ray spectrum. In the radio spectrum, flux is measured at ground-based radio observatories in Solar Flux Units (SFU) where 1 SFU = 10-22 W m-2 Hz-1. X-ray flux is measured by sensors in geosynchronous orbit in the 1 to 8 Angstrom band (0.1 - 0.8 nm). The units are W m-2. Particle flux is measured in Particle Flux Units where 1 pfu is 1 particle per square centimetre per steradian per second
Various relations have been experimentally derived relating the particle flux (J) to the radio semi-integrated flux (F) at either 2695 MHz or 8800 MHz or the X-ray integrated flux (F). Semi-integrated flux is the area under the curve of a radio time plot of flux density (SFU) from the start of the burst (flare) to the half-power point after the maximum. This is usually reached within a few minutes of the time of maximum, allowing time to perform the prediction. If we were to use the total integrated flux (ie to the end of the burst), the particles may already be at Earth orbit! Integrated flux has the units of SFU-sec.
In this particular implementation of the PPM we use the relationship:
Energy Spectrum
We define the integral energy spectrum by:
We can use either the differential energy specrum P(E) or the integral energy spectrum P(>E) where:
P(>E) = A E-Γ
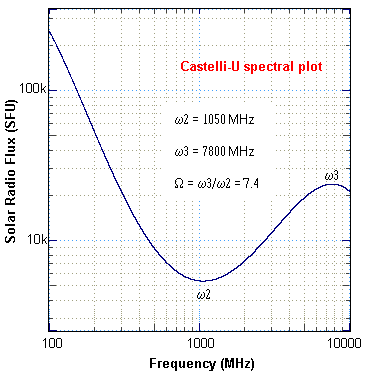
We have already quoted the default expression used for γ. If a U-shaped radio burst has occurred, Bakshi & Barron suggest that we can use the formula:

A Riometer is an instrument that measures cosmic noise absorption (usually in the polar regions) from precipitating particles. The amount of absorption is related to the particle flux:
IMPLEMENTING THE MODEL
The model has been implemented in a QBASIC program called PPM.BAS. It is initiated by the occurrence of solar event that one believes could result in an SPE. This might be a large solar flare (H-alpha or X-rays) in conjunction with a Castelli-U solar radio burst, or a type II / type IV complex solar radio metric spectral signature, or a coronagraph observation of a large coronal mass ejection.
The model inputs are:
Model Outputs
The model output is in the form of two tables:
The second table gives a time history of particle flux for a range of energies, and an estimate of riometer absorption (dB).
The table below gives a quick look at the model output.
              PROTON PREDICTION MODEL
              ***********************

Solar event at  22 S   39 W
Solar wind speed =  450  km/sec
8800 MHz Semi-Integrated Flux (Start to Peak) =  2.2E+07 SFU-s
Castelli-U Omega Ratio (W3/W2) =  5.9

              *** Prediction Parameters ***
                (At Geosynchronous Orbit)

Proton Energy  Onset        Maximum     Peak flux >E  Decay Constant
   E (MeV)     Time(hrs)    Time(hrs)      (PFU)         (hours)

     100         1.4          2.3              0          17.8
      50         1.5          2.6              2          18.3
      20         1.7          3.1             18          18.8
      10         2.0          3.8             82          19.0
       5         2.5          4.7            331          19.2
       2         3.3          6.6           1889          19.4
       1         4.2          8.7           6606          19.5
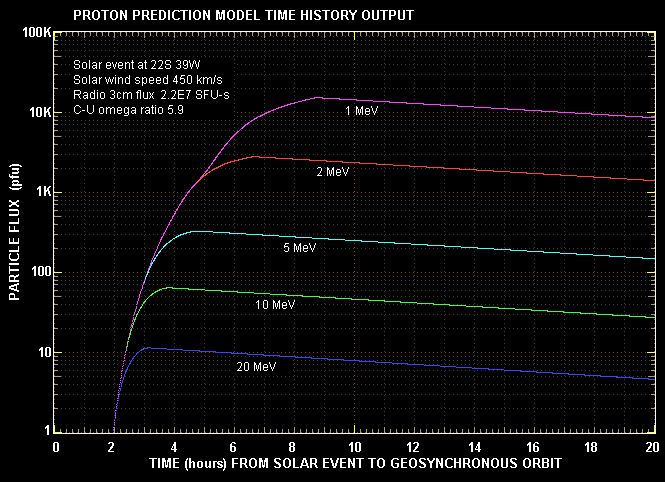
The second output is a time history of particle fluxes for a range of energies. This is plotted graphically below. The zero time reference is the occurrence time of the solar flare (radio or X-rays).

Note that the peak fluxes in the graph do not exactly match the peak fluxes in the table. This is because the 'quick look' parameters compute the energy spectrum coefficient (K) in a slightly different way to that used in the time history. This reflects the inaccuracy spread in the model.
The time history output is also available in text form at PPM.DAT.
REFERENCES
MA Shea & DF Smart, "PPS76 - A Computerized 'Event Mode' Solar Proton Forecasting Technique", Solar-Terrestrial Prediction Proceedings, US Department of Commerce, NOAA/ERL, Boulder, Colorado, 1979, v1, pp406-427 .
P Bakshi & WR Barron, "Prediction of Solar Flare Proton Spectral Slope from Radio Burst Data", Journal of Geophysical Research, 84, pp131+ .
 Australian Space Academy