An earlier version of this material appeared in the Proceedings of the 11th NACAA Conference at Perth under the title "A Comparison of Ground Based Observations of Radio Source Io-B with Results from Voyager"
ABSTRACT
A total of 34 hours and 24 minutes of radio observations of the Jovian Radio Source Io-B were made at a frequency of 20.65 MHz between April 28, 1984 and August 15, 1984. Computer predictions were used to program observations which were made simultaneously from Melbourne and Brisbane using very low resolution radio telescopes. Aural monitoring and intensity measurements (relative to background) were used to identify and classify radio bursts. From the data the source morphology was constructed on the Io-Jupiter phase plane. At the time resolution of the observations the source was resolved into two components. A comparison with the data from Voyager 2 indicates that the lane separating the two components in our data is identical to a 'spectral hole' visible in the spacecraft data. It is suggested that this hole may be caused by a disruption of the electron beam structure. Time averaging of the individual storm data also showed a characteristic (single frequency) spectral arc signature remarkably similar to that seen in the Voyager 2 data. During the course of our observations renewed vigour of the Loki volcano on Io was reported by the University of Hawaii. A comparison made between their albedo measurements of Io and our radio storm index shows an increase in this index at the time of a sudden increase in albedo between June 1, 1984 and June 24, 1984. However, the natural variability of the storm index means that a firm statement about the correlation between volcanism and decametrlc radio emission probably cannot be made at present.
INTRODUCTION
It is now well established that the Earth, Jupiter and Saturn emit radio waves as a result of the energetic interaction between charged particles and the magnetic field and plasma environment in their vicinity (fig. 1). Recent observations made by Voyager 2 show that Uranus also has a magnetic field and that as a result it emits a wide variety of electromagnetic waves. Planetary radio emissions would seem to be relatively commonplace, at least in the Solar System.
Early ground based observations of Jupiter's sporadic decametrlc radio emission gave the first indication and estimate of the strength of the Jovian magnetic field and were successful in establishing the apparent directional nature of this radiation (Burke and Franklin 1955), (Shain 1956). These preliminary estimates of magnetic field strength have been amply supported by subsequent spacecraft observations from Pioneers 10 and 11 (Acuna and Ness 1976). However, the reason for the 'beaming' effect has proved a difficult problem and is still not completely understood.
From an observational point of view, beaming is most apparent above 20 MHz, and leads to radio emission being observable only for certain ranges of Jovian central meridian longitude (CML). At these frequencies, the probability of receiving signals may also be highly dependent on the position (phase) of Io (Bigg 1964) measured as the angular displacement of Io from superior geocentric conjunction (SGC). The complex dependence of the reception probability on the rotational phase relationship of Jupiter and Io are best described by recording the intensity of emission in relation to these variables, i.e. on the Io-Jupiter phase plane. On this plane various radio 'sources' can be defined which have quite unique characteristics, in terms of the type of bursts to be expected (Riihimaa 1965), the dependence or independence on the position of Io, and the polarisation of the emission.
A discussion of the many burst type documents is beyond the scope of this work, and the reader is referred to the literature for more extensive information (e.g. Ellis 1974). While, in general, an accurate assessment of burst type can only be made by making radio spectrometer measurements, the so-called L (long) burst which has a duration of perhaps a second up to a minute or more has such a characteristic sound that it can be relatively easily identified with a little experience using a radio telescope of sufficient sensitivity. Although there is considerable variability from one observation to the next, generally speaking these bursts occur in groups over a period of 10 or 20 seconds and recur every minute or so for 3 to 6 minutes. This process may continue for several minutes or hours and is referred to as a radio noise storm. At times these storms can be very intense.
The bursting phenomenon has long been attributed to the effect of scintillation in the interplanetary medium and the terrestrial ionosphere (Douglas 1967), an effect that is directly analogous to the twinkling of stars due to atmospheric turbulence. Along with the so-called modulation lanes (Riihimaa 1974), which are apparently produced in the vicinity of Jupiter, the scintillation is observed as bursting on a time scale of seconds to a minute, the latter being due to ionospheric influences. However, the reason for the modulation on a time scale of several minutes was not fully understood until the data from the Voyager missions became available in 1979 (Warwick 1979 a & b).
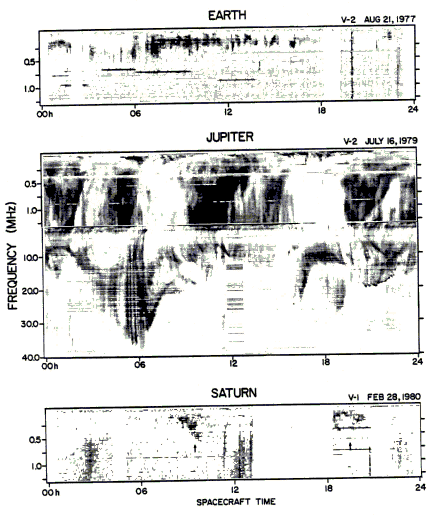
Because the Voyager data were free of the confounding effects of terrestrial radio interference and the inevitable distortions produced by the Earth's ionosphere, its radio spectrometer results were easier to interpret than ground based data collected using essentially similar techniques. The data clearly showed the presence of great spectral arcs extending from less than 1 MHz up to a maximum of 40 MHz. These arcs had the form of nested parentheses, i.e. (((( or )))) and sometimes the radius of curvature of the arc was so large that they appeared to stand up straight on the frequency versus time plot (see fig.1 for an example of this latter type). However, these arcs could generally be characterised as vertex early "(" or vertex late ")".
This crucial finding appeared to support the concept which had been proposed by Dulk in 1965 (Dulk 1965) that the decametric radio emission was beamed into thin sided hollow cones which were concentric with the magnetic flux line on or around which the accelerating electrons producing the radiation were travelling. Under this proposal, it can be shown using a geometric argument (Goldreich and Linden-Bell 1969), (Dessler 1983) that emission may be observed simultaneously from two positions (cones) along a particular magnetic field line. Since the wave frequency of radio emission is proportional to the magnetic flux intensity at the point of generation, radiation from a point which is closer to the planet will occur at a higher frequency than from a point placed further out along a field line. On a radio spectrograph this would therefore reproduce as two points at the same observing time, i.e. two points along the same spectral arc. At some point along the same arc, called the vertex, and generally at a different observing time, only emission from one cone will be visible.
All of the radio sources, defined on the Io-Jupiter phase plane, were found to have distinct spectral signatures. For example, the Io-dependent radio source Io-A exhibited vertex late arcs of high curvature while Io-B consisted of vertex early arcs with a very small curvature. Computer modelling has been used with varying degrees of success to show that at least some of these results are compatible with the conical sheet model. More recently (Green 1984), by reanalysing Voyager data into a time frame such that Jupiter and Io are effectively held stationary while the spacecraft revolves around Jupiter, has shown that two radio beams are prominent in this data format, consistent with a conical sheet model where the two beams are the intersection of the cone with the plane containing the spacecraft trajectory. The angular separation between these beams, i.e. the edges of the cone, was close to 150 degrees, which is the angle between the centroids of the Io dependent sources Io-A and Io-B (γIo = 90 and 240 degrees respectively).
Green interpreted his results in terms of a single broad-edged emission cone moving with Io but not symmetric with respect to the Io flux tube on which the emission is assumed to be generated. The apparent position of the Io-dependent source A and B on the Io-Jupiter phase plane could only be matched if the beaming angle from the field line is about 90 degrees for Io-B and 60 degrees for Io-A. He used a ray tracing model to show that this difference might be due to refrac�tion effects in the Jovian magnetic field, the initial launch angle of the wave being close to 90 degrees in each case.
An alternative interpretation of Green's data may be possible using Gurnett's and Goertz's proposal (Gurnett and Goertz 1981). They attempted to explain the multiple spectral arcs clearly evident in the Voyager data by postulating that the action of the plasma torus sweeping past Io would generate powerful magneto-hydrodynamic waves called Alfven waves which would propogate in the torus ahead of Io (the torus corotates with Jupiter). This propagation was seen as a series of bounces at the torus boundaries where the wave disturbance was reflected. This concept is illustrated in fig. 2. At the point of reflection, a wave packet is launched which propogates along the magnetic field lines which link the plasma torus to the Jovian Ionosphere, thus forming an electron beam which generates radio waves directed into conical sheets as discussed before.
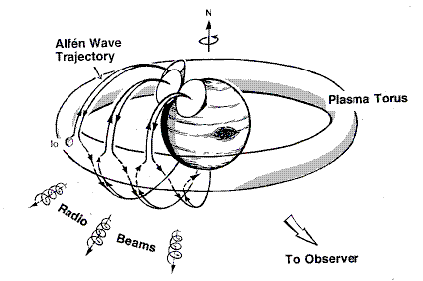
An important distinction between this theory and earlier theories is that the particles generating the radio emission are not on the Io flux tube but may be considerably ahead of it. Assuming a cone semi-angle of close to 90 degrees, reference to Green's data suggests that this 'lead' angle might be as much as 50 degrees with perhaps 4 or 5 separate nested spectral arcs 15 degrees apart being placed between the Io flux tube and the point of generation (see fig. 4 of Green (1984) - between 70 and 120 degrees spacecraft longitude - also see fig. 2).
The degree of damping of the Alfven waves was theoretically estimated by Gurnett and Goertz as allowing between nine and many hundreds of bounces and these would generate a series of nested emission cones. A non-linear damping mechanism was proposed such that the Alfven wave intensity would fall quickly during the first few bounces and then much more gradually thereafter so that the wave might be maintained for more than one passage of the wave around Jupiter. The known enhancement of emission intensity for certain positions of Io can then be readily explained as due to the emission cone associated with these first few energetic bounces being visible. This can only occur for certain positions of Io relative to the observer, i.e. for certain angular displacements of Io from SGC.
There are at least two important consequences of the theory of Gurnett and Goertz outlined above which might be testable experimentally. The first is that apparent source position on the Io-Jupiter phase plane will be dependent on the spacing of the spectral arcs and the second is that changes in spectral arc spacing might be a sensitive index of plasma density in the Torus. This latter conclusion results from the fact that the propogation velocity of the Alfven disturbance is inversely proportional to the square root of the plasma density in the Torus. Therefore, if, for example, Io was active volcanically and, as a consequence, the plasma concentration were altered, then this may cause measureable changes in arc spacing with time. Unfortunately there have been no further spacecraft missions to Jupiter since 1979 so that this hypothesis cannot be tested.
Therefore, our long term aim is to establish the feasibility of employing relatively unsophisticated single frequency ground based observations to determine if the spectral arc spacing changes over a period of years and whether such changes (if they occur) are correlated with radio source position or other measureable changes in the plasma Torus. The data reported here are observations of the radio source Io-B during the 1984 apparition of Jupiter. An attempt is made to relate these observations to Voyager observations taken in 1979 and to establish a connection between albedo measurements,of Io made at the University of Hawaii (Marsden 1984) during this same apparition.
OBSERVING METHODS
General
A total of 34 hours 24 minutes of scheduled observations were made between April 28, 1984 and August 15, 1984 at Forest Hill Observatory (MW) in Melbourne and at Holland Park Observatory (CCR) in Brisbane. In general, observations made at the two observatories were well correlated on a time scale of several minutes or more but the timing of individual bursts was poorly correlated. The data reported here are a composite of data from both observatories. This observing protocol, using well-spaced observations (>1500 km) along a north-south line, was useful in reducing the possibility of spurious identification of Jupiter emission with local interference, some of which can sound very similar.
Jupiter-to-Earth Geometry
All of the observations were computer scheduled and were made with Jupiter between zenith angles of +/- 45 degrees (-3dB points of the antenna pattern) and between 1700 and 0600 local time. During the period of observations, Jupiter was +2 months from opposition. The Earth-Jupiter distance was 4.39 AU +/- 0.18 AU (mean +/- sd, range 4.2 to 4.73 AU). The calculated maximum error in burst intensity determination due to changes in distance is less than l dB. The Jovicentric declination (De) of the Earth as viewed from Jupiter was 1.93+/-.012 degrees during the 1984 observations.
All the observations were scheduled in a nominal 'window' on the Io-Jupiter phase plane corresponding to the radio source Io-B. The window limits were defined as CML longitude between 95 and 195 degrees (system III coordinates 1965) for Jupiter and 65 to 110 degrees from SGC for Io (Carr and Desch 1976, and refer to fig. 3).
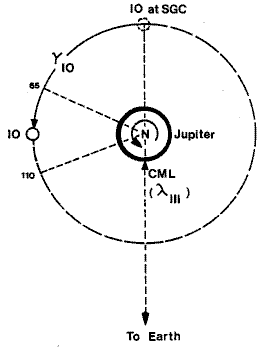 |
Figure 3: A diagram showing the observing conventions used to descxribe the occurrence of decametric emission. Jupiter and Io are views from above Jupiter's north pole. The position of Io is measured as the angular displacement from superior geocentric conjunction (SGC). Notice that the Earth-Jupiter line of sight is the reference for this measurement. The rotational phase of Jupiter is described in terms of the central meridian longitude (CML) and is measured in system III (1965) coordinates for radio work. Also shown (dotted) are the limits (65 to 11o degrees) between which Io must be in order to receive radio emission. These limits define radio source Io-B. |
Each observer was provided with a summary of relevant observing data prior to each observing session. This data included an observing table in which burst occurrences could be recorded (see fig. 4) and an Io-Jupiter phase diagram onto which the observations could also be recorded, giving an immediate impression of the phase relationship of lo and Jupiter at the time of the burst (see fig. 5).
                   RADIO SOURCE IO-B
                   *****************
REFERENCE DATE    DY  3    MN  3    YR  1983   (IO AT SGC+65 deg)

WINDOW DATA
-----------
OPENING TIME  IS=        02h35m    ON REFERENCE DATE
HOUR ANGLE AT OPENING IS = 7.34
ELEV. AT OPENING IS = 71.82
AZ. AT OPENING IS = 337.30
HOUR ANGLE AT CLOSING IS =   48.69
ELEV. AT CLOSING  IS = 44.85
AZ. AT CLOSING IS = 277.94
TIME  IN WINDOW = 2h45m
SUB-IO LONGITUDE IS  182 Deg @ 02hl4m

OBSERVING DATA
--------------
LENGTH OF OBSERVING PERIOD IS = 2h45m
START OBS. TIME =02h33m	 HR.ANG=  7.34	ELEV. 71.82  AZ.= 337.50
  END OBS. TIME =03h20m	 HR.ANG= 48.69	ELEV. 44.83  AZ.= 277.94
POSSIBLE BIG BURSTS BETWEEN APPROXIMATELY 03h15m  AND 04h29m
OPTIMUM CONFIG. ***********

JUPITER DATA FOR 10 AT SGC*65 deg
---------------------------------
JOVIAN CENTRAL MERIDIAN LONG. SYS1=331.96  SYS2=319.03  SYS3= 21.31
JD2445457.10600 YR 1983 MN 3 DY 3	HR 00 MIN 34(AEST)
HR.ANG.=336.86	LST=14.92   JOVICENTRIC DEC OF EARTH= -3.10
RA= 16h28m   DEC= -20d49m        AZ=  36.11	ELEV= 63.74
EARTH-JUPITER DISTANCE   4.44 AU  EQUAT. DIAM.=   44.3 arc-sec

JUPITER DATA FOR IO AT SGC+110 deg
----------------------------------
JOVIAN CENTRAL MERIDIAN LONG. SYS1=166.49  SYS2=151.87  SYS3=214.20
JD2445457.32755 YR 1983 MN 5 DY 3	HR 05 MIN 53(AEST)
HR.ANG.= 57.08	LST=20.27   JOVICENTRIC DEC OF EARTH= -3.10
RA= 16h27m   DEC= -20d48m        AZ= 272.27	ELEV= 38.25
EARTH-JUPITER DISTANCE   4.44 AU  EQUAT. DIAM.=   44.4 arc-sec

             OBSERVERS COMMENTS  (NAME:                      )
DATE     TIME (UT)   TAPE COUNT   BURST DESCRIPTION    OBS. FREQ.
       |           |            |                    |
       |           |            |                    |
       |           |            |                    |
       |           |            |                    |
       |           |            |                    |
       |           |            |                    |
       |           |            |                    |
Figure 4: A computer generated prediction sheet used to forecast observing times. It also includes a table in which burst observations can be recorded. All times are local time (AEST). Accurate positional data are not really required for radio work but are useful for visual observations which were done occasionally. The azimuth and elevation data were used to ensure that the planet was within the receiving antenna pattern during the observing period.
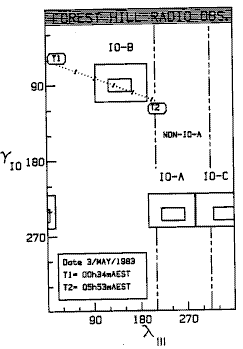 | Figure 5: A graphical summary of the observing data. The occurrence of bursts can be recorded along the graduated "Time Line" between T1 and T2 as well as in the burst table of fig. 4. Also shown on this graph are several other radio sources, ie Io-A, Io-C and non Io-A which have been observed during the program. The small window inside the Io-B source location boundaries was deduced from Carr and Desch (1976) and is an area where large bursts can be expected. |
Equipment
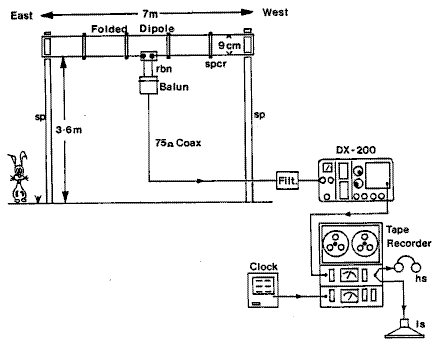
The radio telescope used for this study consisted of a DX-200 communications receiver with a predetection bandwidth of 4KHz and a sensitivity of 0.5 microvolts for l0dB signal-to-noise ratio in AM mode, coupled to a half wave folded dipole antenna suspended one quarter wavelength above the ground and directed east-west. The antenna gain was estimated as 6dB and the bandwidth +2MHz. The antenna was matched to a 75 ohm coaxial feeder cable (Belden 8259) using a broadband 4:1 toroidal transformer. The design of this transformer is described in the ARRL handbook. Impedance measurements made using an MFJ-202 RF noise bridge showed that the impedance was close to 75 ohms over the operating bandwidth.
| Figure 6a: Interior of the balun used to match the antenna to the feedline. | 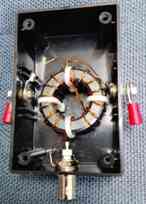
|
The bandwidth capability of this antenna, coupled with the fact that the decametric radiation is generally broad-band in nature, allows small changes in observing frequency to be made if terrestrial radio interference was encountered. Such interference can be minimised by observing during the early hours of the morning; however, such a constraint reduces the available observing windows.
A tuned filter with a bandwidth of 2MHz was also used in the antenna cable to improve the image rejection capability of the DX-200 receiver on the high frequency band and also to eliminate the detrimental effects of very strong broadcast-band (500-1500KHz) signals which were sometimes found to have signal intensities of several hundred millivolts at the antenna terminals. This compares very unfavourably with the microvolt and sub-microvolt level signals coming from the vicinity of Jupiter. However, on many receivers such a filter is probably unnecessary. As an additional aid to improving reception, the automatic gain control (AGC) was disabled.
The receiver output was fed to an Akai reel to reel stereo tape recorder along with a time signal derived from a modified voice synthesised digital clock (Tandy Corporation). The clock was modified to announce the time each minute so that if necessary, observations could be made without the observer in attendance. The tape could then be analysed at a later time. The clock was synchronised to one of the short-wave time services (WWV or VNG) before each observing session.
The output of the recorder was used to drive a 7.5-inch automobile radio loudspeaker and a set of stereo headphones. In general, the output from the small loudspeaker was found to be superior for this work, allowing a clearer definition of the characteristic L-burst sound. The VU level meters were used to record burst amplitude and detect slow changes in intensity which can be very difficult to detect by ear.
Recording Technique
At the start of a recording session the VU meter on the recorder was set to -3dB on background noise. At this time a system check was made by disconnecting the antenna momentarily. Receiver output noise level usually fell by 10dB or more, indicating the predominance of antenna (sky) noise. A burst was recorded in the report table when the characteristic L-burst sound was heard (sometimes described as waves crashing on a beach) and the recording level increased by 2dB or more, i.e. to -1dB or greater on the VU meter. When a burst was recorded with an amplitude greater than +3db on the VU meter this was recorded as a 'Big Burst'. We estimate that these bursts would correspond to a peak incident flux intensity of 6.6 million Jansky and would result in a peak voltage of about 1 microvolt at the antenna terminals. Burst time was recorded to the nearest minute. The total number of bursts was not recorded in the table but could be analysed from the tape. The data reported in this paper essentially refer to active minutes rather than individual bursts.
Preliminary Trial
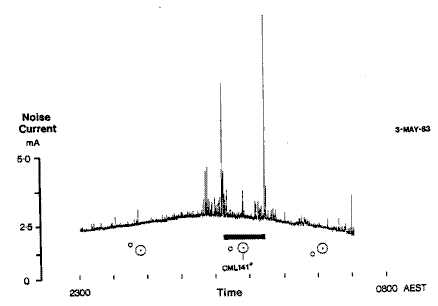
To test the validity of the computer predictions and to measure signal amplitude, a preliminary series of observations was made in May, 1983 using a Dicke radiometer receiver with a servoed noise source (on loan from the Antarctic division - Department of Science) and a pen recorder. The result of one such observation is shown in figure 7 and clearly shows the remarkable predictability of the emission. This recording is calibrated in terms of noise diode current, i.e. received power. Notice that the burst amplitude can be at least four times the background. Also shown is the sudden onset of reception. This sort of observation might be expected if the radiation is concentrated into a beamed radiation pattern.
DISCUSSION AND RESULTS
Source Morphology
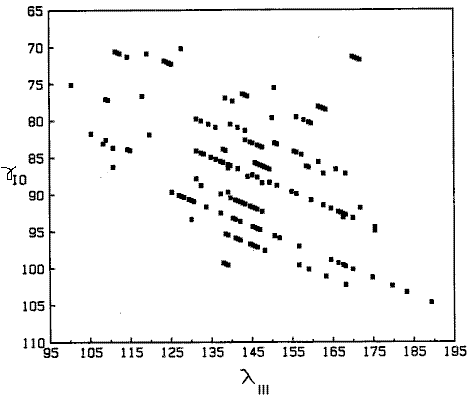
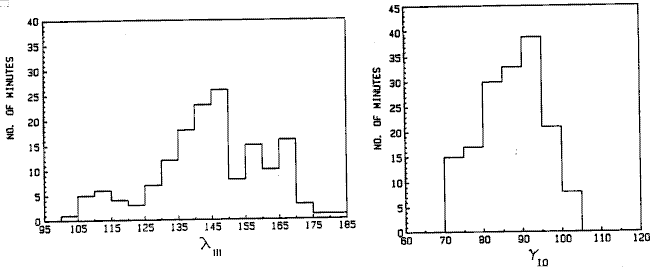
All of our observations are plotted on the Io-Jupiter phase plane in fig. 8 and in two histograms, fig. 9a and fig. 9b, which clearly show the directional nature of the decametric radiation. Fig. 8. shows two interesting features of the Io-B morphology.
(1) When observed at low sensitivity, the source resolves into two parts separated by a lane of reduced probability of detection which is observed when Jovian CML is between 110 and 130 degrees. The exact position appears to be a function of lo phase.
(2) Some of the observations show evidence of a quasi-periodic activity pattern with groups of bursts appearing roughly every ten degrees in CML longitude. This pattern is more noticeable for Io at less than 85 degrees from SGC.
The lane feature referred to in (1) appears to be similar in position to a lane which appears in the L2 data reported without further comment by Riihimaa (Riihimaa 1975). The bifurcation of source B had also been inferred by previous high resolution studies (Leacock and Smith 1973). They suggested that such a feature might imply Cerenkov radiation. It is of interest to note that a spectral hole can be seen in the Voyager data in figure 1 placed immediately after the first three spectral arcs at a spacecraft event time of about 0530. This event (July 16, 1979) is an Io-B storm and has been extensively illustrated by other authors (Menietti 1983, Green 1984). Close examination of this data reveals that the spectral hole is positioned close to a spacecraft CML longitude of 110 at a frequency of 20.65 MHz.
We attempted to gain some further insight into the reason for such a hole by plotting the data in reverse from storm end. We reasoned that if the spectral arcs observed were caused by the Alfven wave system, then the end of the storm in time would correspond to the initiation of the observable disturbance by Io. Once the nested emission cones are set up by the Alfven current system they are viewed essentially backwards with the last generated cone being viewed first (see fig. 2).
The results are shown in fig. 10. Three prominent arc points are visible in this diagram at 30, 45 and 60 minutes and these points match the Voyager arc positions for this event rather well. Also clear is a missing arc at 75 minutes which corresponds to the spectral hole on the phase diagram (fig. 8) and in fig. 1. It is also apparent that the arc structure reappears at 90 minutes, suggesting that the reason for the missing arc is not to be found in a disturbance of the Alfven standing wave system but rather it is either a result of a sudden change in emission cone visibility, or due to some failure of the electron beam structure.
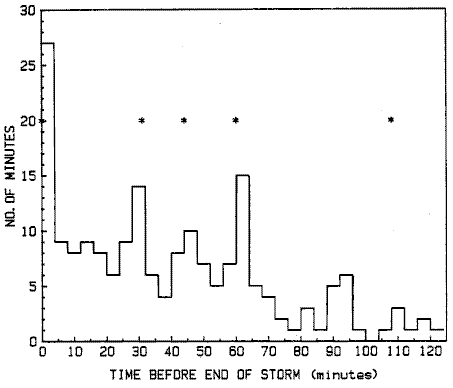
The computer models developed to date (e.g. Hashimoto and Goldstein 1983) do not appear to support the possibility of a spectral hole due to a sudden change of visibility, although a higher order twist in the magnetic field, if present, may not be adequately modelled by the 04 model of Acuna and Ness.
Reference to the Voyager data shows that the spectral hole occurs at the point at which hectometric radiation (0.5 to 5 MHz) peaks (see fig. 1), suggesting that there might be selective use of electron beam energy at this longitude which leads to a smaller extension of the wave packet towards the Jovian Ionosphere. This would limit the upper frequency extent of the observed decametric emission. Eight big bursts were recorded during the observing session. These came from a region on the Io-Jupiter phase plane centered on CML = 144+/-4.6 (mean +/-SE, N = 8) degrees and Io position 91.1+/-2.2 degrees from SGC.
Io Volcanism
Albedo measurements of Io assembled by the University of Hawaii between April 12, 1983 and July 17, 1983 (Marsden 1984) indicated a renewed vigour in the Loki volcanic eruption during this period. These data have been plotted in figure 11 along with the radio storm index which is calculated from our data as the total number of active minutes in the storm observed on the date indicated. Because of the strong dependence of activity on Io position (see fig. 9b) the storm data used in this figure are selected so that, at a particular CML longitude, Io is within +/-2.5 degrees for all four storms plotted (interestingly, the four points are spaced almost exactly one month apart in time). Unfortunately, this selection process severely limited the useable data so that a firm conclusion probably cannot be made, but there does seem to be an increase in storm index as albedo rises. The median storm index for all the data was 11, so that the storm on June 30, which had an index of about 28, was almost three times the median value.
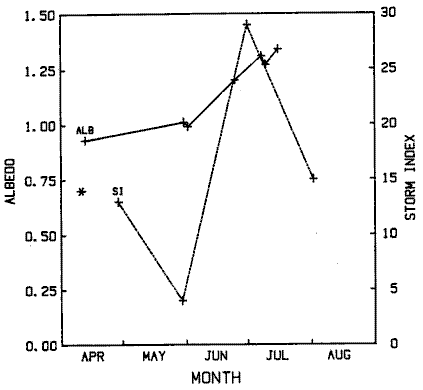
Even though, as stated above, a definite statement on a correlation cannot be made on the basis of these data, we present this observation as a subject of possible further study. It is clear that a sampling limitation exists with ground based observations - such a problem would be overcome with the observations from spacecraft, or cooperative ground based observations made from observatories well spaced in longitude.
CONCLUSIONS
The observations reported here indicate clearly that a useful survey of Io-B can be carried out quickly with a low resolution radio telescope when observations are computer scheduled. It is interesting to note that some emission was recorded on every night so scheduled. The comparison of spectral arc spacing between our data and data from Voyager 2 suggests that the plasma density on the Io Torus is stable over long periods.
ACKNOWLEDGEMENTS
Many people contributed directly or indirectly to the success of this program but the author would particularly like to thank his co-observer Col Robertson in Brisbane, who made many more observations than are reported here. Some of these will be the subject of further work. Col is a meticulous and persistent observer without whose help this program could not have been completed.
David Moore's untimely death during the program was a great personal loss to members of the radio group. He was a person of great enthusiasm, and capacity to learn, and was a key person in some of our early experiments. He is sadly missed.
Thanks also go to my long time friend Dr. John Kennewell of Learmonth Solar Observatory who made some very valuable radio-spectrographic observations of Io-B, Dr. Mike Desch of Goddard Space Flight Centre, Dr. James Green of Marshall Space Flight Centre and Professor G. R. A. Ellis of the Physics Department, University of Tasmania who drew my attention to the Io albedo measurements and their possible connection with volcanic activity.
REFERENCES
Acuna, M. H., Ness, N. F.: The Main Magnetic Field of Jupiter. J. Geophys. Res., 81:2917, 1976.
Bigg, E. K.: Influence of the Satellite Io on Jupiter's Decametric Radiation. Nature, 203:1008, 1964.
Burke, B. F., and Franklin, K. L.: Observations of a Variable Radio Source Associated with the Planet Jupiter. J. Geophys. Res., 60:213, 1955.
Carr, T. D., and Desch, M. D.: Recent Decametric and Hectametric Observations of Jupiter. In Jupiter, Ed. T. Gehrels, pp. 693-735. University of Arizona Press, Tucson, 1976.
Dessler, A. J. Ed.: Physics of the Jovian Magnetosphere. Cambridge University Press. 1983.
Douglas, J. N., and Smith, H. J.: Interplanetary Scintillation in Jovian Decametric Radiation. Astrophys. J., 148:885, 1967.
Dulk, G. A.: Io-Related Emission from Jupiter. PhD Thesis, University of Colorado, Boulder, Colorado, 1965.
Ellis, G. R. A.: The Jupiter Radio Bursts. Proc. Astron. Soc. Aust. 2:236, 1974.
Goldreich, P. and Lynden-Bell, D.: Io, a Jovian Unipolar Inductor. Astrophys. J., 156:59, 1969.
Green, J. L.: The Io Decametric Emission Cone. Radio Science, 19:556, 1984.
Gurnett, D. A. and Goertz, C. K.: Multiple Alfven Wave Reflections Excited by Io: Origin of the Jovian Decametric Arcs. J. Geophys. Res., 88:2010, 1983.
Leacock, R. L. and Smith, A. G.: Fine Structure of Jupiter's Decametric Source B. Nature Physic. Sc., 244:60, 1973.
Marsden, B. G.: I.A.U. Circular for July 23, 1984.
Menietti, J. D., Green, J. L., Gulkis, S., Six, F.: Three-Dimensional Ray Tracing of the Jovian Magnetosphere in the Low-Frequency Ranqe. J. Geophys. Res., 89:1489, 1984.
Riihimaa, J. J.: Modulation Lanes in the Dynamic Spectra of Jupiter's Decametric Radio Emission. Ann. Acad. Sci. Fennicae A, VI, 413.
Shain, C. A.: 18.3 MHz Radiation from Jupiter. Aust. J. Phys. 9:61, 1956.
Warwick, J. W. et al: Voyager I Planetary Radio Astronomy Observations near Jupiter. Science, 204:995, 1979a.
Warwick, J. W. et al: Planetary Radio Astronomy Observations from Voyager 2 near Jupiter. Science, 206:991, 1979b.
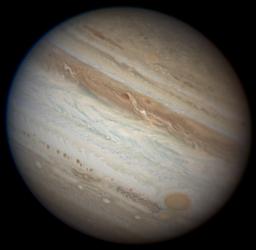 |
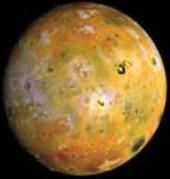 Above: The Jovian moon Io Left: Jupiter Image by Anthony Wesley, Exmouth, Western Australia |
 Australian Space Academy