SPACE DEBRIS CREATION AND COLLISIONAL CASCADES
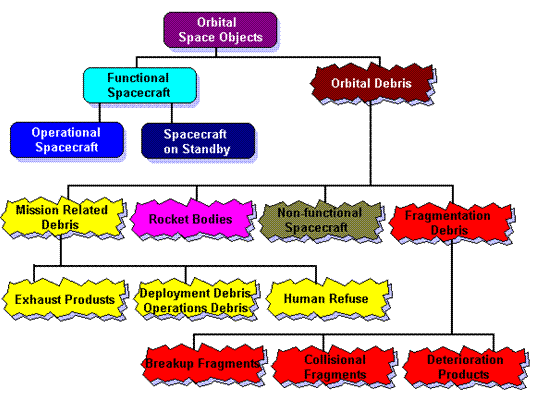
Space debris is created through a number of mechanisms. This is illustrated in the following diagram.

Just launching a satellite into space creates dozens of fragments of space debris. The last stage of the rocket that launched the satellite often remains in orbit. The protective shroud that enclosed the satellite payload becomes debris. The explosive separation of the shroud, payload and rocket body releases a lot of small debris fragments.
In orbit operations can produce space debris. When a satellite reaches the end of its operational life it becomes a large piece of debris. Deterioration of a satellite through the action of solar UV and other environmental factors can release small pieces of debris. A prime example of this is the release of paint flakes.
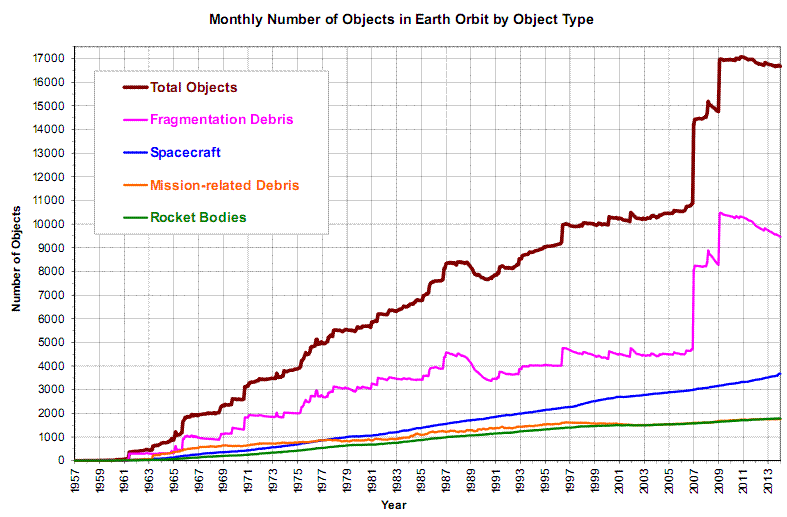
Fragmentation events are a major source in the generation of larger debris fragments. These events can be either internal or breakup events, or they may be external or collisional events. Breakup events occur when satellites or rocket bodies explosively fragment through the release of internal stored energy (eg batteries, unspent fuel). Accidental and deliberate hypervelocity collisions are not currently very frequent in low Earth orbit (LEO), but can have devastating consequences when they occur (eg a deliberate Chinese collision in 2007 now (in 2016) accounts for about 20% of all low Earth centimetric and larger orbital space debris).
Although not currently important, eventually collisional cascading will account for the majority of orbital space debris creation, at least in LEO [1]. This is equivalent to a chain reaction where one collision produces sufficient debris to cause several other collisions, and so on. Eventually the situation becomes so dominated by collisions that newly launched satellites will be destroyed within a few months of launch. This is why it is important to try and model the evolution of space debris in low Earth orbit, so that the impact of various mitigation actions can be determined.
MODELS
The large space agencies have debris propagation models to determine the evolution of the LEO space debris population. The main NASA model is called LEGEND [5]. A team at the University of Pisa in Italy is actively working on debris evolution models [3,4].
A SIMPLE MODEL
A simple model developed by Farinella and Cordelli at Pisa was published in 1991 [2], and shows the essential details of the collisional cascade process. The diagram below gives a visual outline of the processes involved.
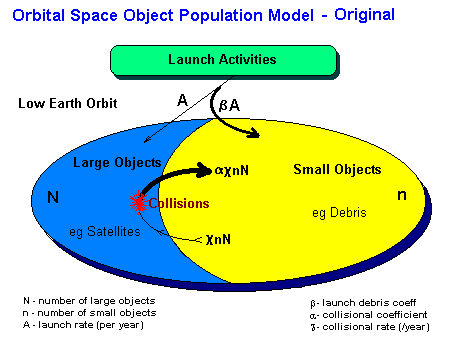
The model breaks the orbital population into two groups:
Collision rate is proportional to both the number of satellites and the number of debris fragments. The proportionality constant for this event is signified by χ. For each such collision it is assumed that α debris fragments are generated.
On launch it is assumed that one satellite and β pieces of debris are placed in orbit.
Putting this all together, we have a model that is specified by two first order coupled differential equations, with four variable coefficients and two initial or boundary conditions:
dn/dt = β A + α χ n N . . (2)
CONSTANTS AND COEFFICIENTS
If we take our start as around the year 2000, then we can assume about N=2000 active satellites and n=50,000 debris pieces (greater than a few centimetres in diameter). These are our two initial values or boundary conditions.
The values of the four constants or coefficients will be initially assumed to be:
|
Space Debris Collision Rate
The collision rate can be estimated by considering the collisional cross sectional area (see diagram below):
Consider a debris particle moving at a velocity v passing through a cross-sectional area A orthogonal to its direction of travel. In a time t it will move a distance d = v t, which means that it moves through a volume V = A d = A v t. In this volume there exist n active satellites. These satellites will present a total area to the particle of An = n As, where As is the cross-sectional area of a single satellite (~ 1 m2). The collisional cross-section for the particle is then given as the fractional area that the satellites present:
Now the collisional coefficient χ which is the number of collisions per unit time per unit satellite is:
|
IMPLEMENTATION
The above model was coded in 18 lines of QBasic, and is shown below for those who would easily like to run the model with different parameters and initial conditions.
'Orbital Space Debris - (simplified model from Farinella and Cordelli 1991)
Nsat = 2000                        'initial number of active satellites
Ndebris = 50000                    'initial number of debris
t0 = 0: CLS                        'start year / clear screen
A = 100                            'annual insertion rate
chi = 3E-10                        'annual collision rate
alpha = 2000                       'collision generation coeff
beta = 30                          'primary debris coeff
PRINT "Year   Sats       Debris"   'print heading
f$ = "####  #####  ###,###,###"    'print format
FOR tm = t0 TO t0 + 500            'cycle one year at a time
  IF tm MOD 50 = 0 THEN PRINT USING f$; tm; Nsat; Ndebris
  colrat = chi * Ndebris * Nsat    'collision rate
  dsat = A - colrat                'increase in satellites
  ddebris = beta * A + alpha * colrat  'debris increase
  Nsat = Nsat + dsat                'new number of satellites
  Ndebris = Ndebris + ddebris       'new debris count
NEXT tm
OUTPUT
The above code produces a text output as shown below:
       Year     Sats       Debris
          0     2000       50,000
         50     6990      219,371
        100    11942      465,719
        150    16798      903,299
        200    21425    1,799,847
        250    25480    3,840,827
        300    28079    8,791,400
        350    27297   20,506,156
        400    21112   43,026,092
        450    12199   71,001,504
        500     6295   92,959,664
A graphical output for the same parameters is shown below:
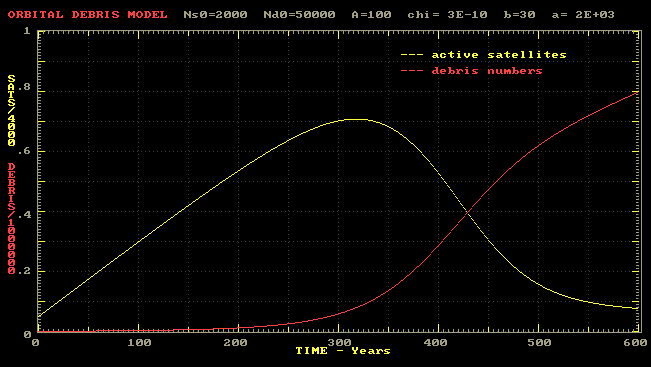
Note that the scale is vastly different for satellites and debris fragments.
USING THE MODEL
The simple model described above can still be usefully used to examine how the space debris population varies under different assumptions.
There are four constants/coefficients. Try varying these in turn and then two together and plot the results. Try different output metrics of say time to peak satellite numbers, or ten-fold increase in debris numbers, and others. Modify the program slightly, so you can stop launches to LEO at different times. Etc..
EXTENSIONS
The simple model described above has some limitations or physical unrealities that can be rectified relatively easily while still retaining the essential simplicity of the original. The new physics is shown in the figure below:
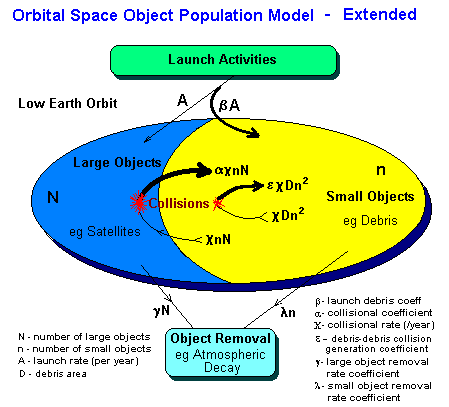
The new equations for this extended model are given by:
The extended model also allows for more realistic debris sinks. Large objects and small objects can be removed separately. While there will be a removal of both types of object through natural causes (eg atmospheric drag) which will be proportional to the number of objects present in each population, mitigation effects (say using laser removal on small objects) are more likely to be a constant rate.
In the real world, each collision produces a pseudo-continuum of sizes with the size distribution given by the form: N (> d) = k d-s where N is the number of debris pieces exceeding a diameter of d, and k and s are constants.
After a large number of collisions in any population similar to this (eg asteroids, meteoroids) it is found that s tends to a value of 2.
The next figure shows the empirically determined population size distribution of low Earth orbital debris in 1998 [6]. Even after this short a time period the exponent is close to -2.
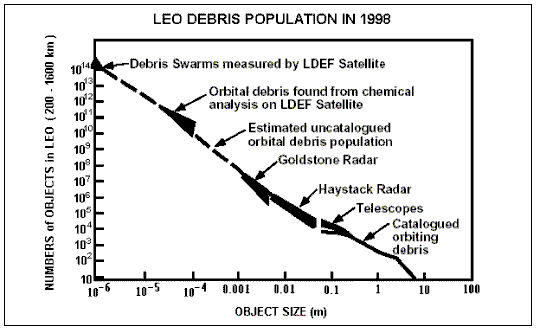
| The number of debris objects in low Earth orbit (between 200 and 1600 km altitude) estimated by the NASA Orbital Debris Program Office as of 1998 [6]. This distribution may be approximated by the empirical expression N(> d) = 800 d-1.9 where d is in metres. Many different types of sensors, as indicated, are required to provide the data covering such a large size range. |
The program to implement a text output version of the extended model is given as QBASIC source code in OSDMOD-E.BAS .
The output from this version of the extended model is shown below. The constants, coefficients and boundary conditions are:
       Date   Sats   Debris   Microdebris
               (num)  (num)      (num)
       2000   2000   5.0E+04    1.0E+16
       2050   6986   3.3E+05    6.5E+16
       2100  11913   7.2E+05    1.4E+17
       2150  16689   1.4E+06    2.8E+17
       2200  21110   2.8E+06    5.6E+17
       2250  24670   6.0E+06    1.2E+18
       2300  26181   1.3E+07    2.7E+18
       2350  23565   2.9E+07    5.9E+18
       2400  16100   5.7E+07    1.1E+19
       2450   8206   9.1E+07    1.8E+19
       2500   3960   1.3E+08    2.5E+19
       2550   2324   1.7E+08    3.5E+19
       2600   1525   2.5E+08    5.0E+19
       2650    910   4.1E+08    8.2E+19
       2700    351   1.1E+09    2.1E+20
The above implementation does not deal with debris removal to the extent that the model allows and could be vastly improved. There is considerable scope to use this model to investigate various mitigation techniques, and some of the events that have occurred in the actual evolution plot of space debris growth to date (below - from NASA Orbital Debris Program Office).
REFERENCES
 Australian Space Academy